Understanding the future is an ongoing challenge across disciplines. In today’s data-driven world, predictive analytics offers insights into what lies ahead based on historical data and advanced analytical techniques. This capability is crucial in guiding organizations towards proactive decision-making, optimizing operations, and capitalizing on emerging opportunities.
A recent market report revealed that the global predictive analytics market is expected to reach USD 28.1 billion by 2026. This rapid growth underscores the increasing reliance on data-driven decision-making across various sectors.
In this blog, we will define predictive analytics, explore various methods, examine industry applications, discuss AI integration, and introduce common predictive analytics tools.
Keep reading to discover how your organization can effectively leverage predictive analytics.
What is Predictive Analytics?
Predictive Analytics is a branch of advanced analytics which focuses on utilizing historical data and statistical processes, to determine possible future outcomes. Such processes include:
- Data analysis
- Machine learning (ML)
- Artificial intelligence (AI)
- Data mining techniques
- Statistical modeling
Predictive analysis enables decision-makers across industries to strategize with insights about potential future scenarios. It also helps organizations refine their planning and optimize outcomes by anticipating what might happen next.
How do predictive analytics work?
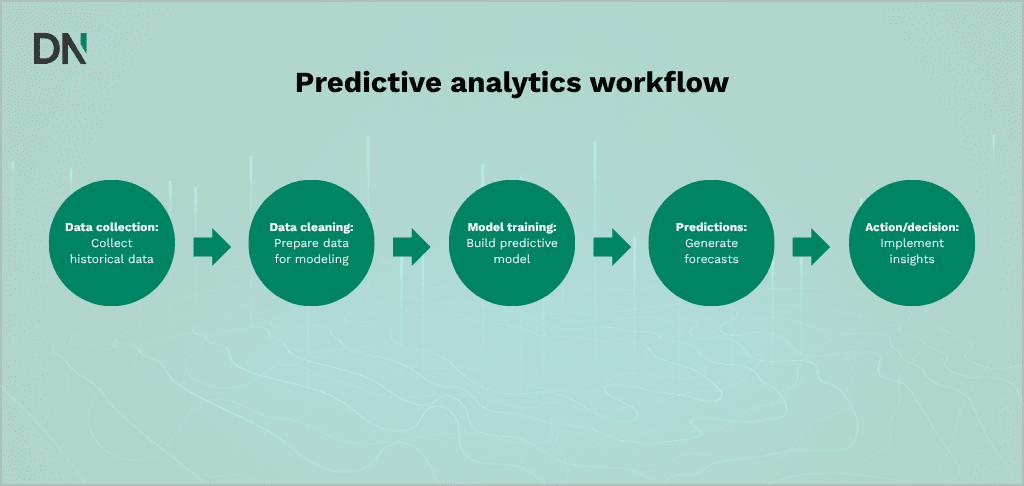
Predictive analytics uses existing data to create a model that forecasts values for new data. These models (called predictive models) produce predictions as probabilities of a target variable (like revenue) based on the importance of various input variables.
Predictive analytics techniques
Predictive models are crafted to analyze past data, identify underlying patterns and trends, and leverage this insight to foresee upcoming developments.
Classification models
Classification models, a type of supervised machine learning, analyze historical data to sort information into categories, helping in tasks like customer segmentation or binary decisions such as fraud detection and credit scoring. Classification models that are commonly used include regression, decision trees, random forests, and neural networks.
Regression
Let’s start with regression. Models using regression estimate relationships between two or more variables to predict outcomes. They range from simple models with one independent variable (called simple linear regression) to complex ones with multiple variables, also known as multiple linear regression.
In simple terms, the main goal of regression is to predict or explain one variable (called the dependent variable) based on the values of other variables (called independent variables).
Organizations use these models for ‘what-if’ analysis, testing how changes in independent variables affect results. For example, analyzing how product qualities, like color, can impact sales or reveal correlations, such as blue shirts selling more. Further analysis might include size, seasonality, or placement, helping guide marketing and product development.
Decision trees
Decision trees are classification models that divide data into subsets based on input variables, illustrating decision paths. Each branch represents a choice, and each leaf signifies a classification or decision.
These models identify the variable that best splits the data into distinct groups. Decision trees are popular for their simplicity and ease of interpretation. They handle missing values well and are useful for initial variable selection, making them a good starting point when you need a quick and clear answer.
For instance, think about a marketing team that needs to decide who gets a promotional email for a new product. By implementing the decision tree model, they start by segmenting the customer base into branches. The first decision branch is “Has Purchased Before”: if yes, the path leads to “Preferred Product Category”; if they prefer gadgets, they receive a tech-product promo email. If no previous purchase, the branch checks “Age”: under 25 get a trendy item email; over 25 get a practical item email. The type of email sent is represented by a leaf on that branch.
Neural networks
Neural networks model complex relationships and are valued for their power and flexibility, especially in handling nonlinear data (data where the relationship between variables forms a curve or complex shape rather than a straight line).
They are often used to validate findings from simpler techniques like regression and decision trees. Based on pattern recognition and Artificial Intelligence, they graphically model parameters.
Neural networks excel when no clear mathematical formula exists or large amounts of training data is available. Originally neural networks were developed to mimic the human brain’s neurophysiology, effective for sophisticated data analysis.
Clustering models
Clustering models, a type of unsupervised learning, group data by similar attributes. For instance, an e-commerce site can use them to segment customers based on common features, tailoring marketing strategies for each group.
Time series models
Time series models use data that is collected at specific time intervals, like daily or monthly, to analyze seasonality, trends, and cycles. Common models include Autoregressive (AR), Moving Average (MA), ARMA, and ARIMA. For example, a call center can use a time series model to predict hourly call volumes at different times of the day.
Predictive analytics in artificial intelligence
Predictive analytics leverages Artificial Intelligence to enhance its ability to forecast future events by analyzing historical data. Machine learning, a crucial aspect of AI, is frequently used in predictive analytics to improve prediction accuracy and efficiency. By examining large datasets, machine learning algorithms can detect complex patterns and relationships that traditional statistical methods might overlook.
Furthermore, AI automates repetitive data tasks, enhances data accuracy and produces actionable insights. This automation enables predictive analytics to handle data more quickly and accurately, resulting in improved decision-making and increased innovation.
Benefits & challenges of AI-enhanced predictive analytics models
There are numerous benefits when implementing AI in predictive analytics. For example:
- Enhanced decision-making: The combination of AI and predictive analytics enables businesses to make more informed decisions by offering deeper data insights. For instance, in engineering, predictive analytics can predict equipment failures, while AI can optimize maintenance schedules.
- Automating data processing: AI significantly accelerates data processing, reducing the time required from weeks to only hours or minutes. It minimizes human errors by reducing manual tasks, ensuring fewer mistakes, such as incorrect labels or corrupted data. Automation also leads to cost savings by increasing efficiency and reducing the need for manual labor.
Additionally, AI improves data quality by detecting and correcting anomalies, ensuring the data is reliable and accurate. - Data accuracy: AI and predictive analytics enhance data accuracy by detecting subtle patterns in large datasets that might be overlooked by humans, allowing for early corrections. This ensures data is more complete by filling in missing information, more reliable by fixing inconsistencies early, and continually improving as the tools learn. Improved data accuracy means the data can be trusted for critical decisions and analysis.
- Industry impact and actionable insights: AI and predictive analytics help companies extract valuable insights by using predictive modeling to forecast trends and outcomes. AI uncovers hidden data connections, presenting clear and visual insights while continuously learning from new data.
This data-driven approach improves products, services, and business growth. For example, online retailers use predictive analytics to anticipate customer purchases based on historical buying habits, while AI can refine these predictions by learning from new data and adjusting recommendations in real-time.
However, there are some challenges to be considered:
- Data requirements: Both AI and predictive analytics require large amounts of historical data to function effectively. Insufficient data can limit the accuracy of predictions.
- Expertise and bias: Implementing these technologies requires specialized expertise in machine learning and data science. Additionally, biases in training data can lead to biased AI models, necessitating careful management and oversight.
Overall, AI and predictive analytics are interconnected technologies that enhance each other’s capabilities. AI provides the algorithms and tools that increase the efficiency and accuracy of predictive analytics, while predictive analytics leverages AI for better forecasting and decision-making. Together, they transform data into strategic assets, enabling innovation and improving outcomes across various sectors.
Applications across industries
Predictive analytics is widely used across various industries to enhance decision-making, optimize operations, and improve outcomes. Here are some key industries utilizing predictive analytics along with specific case examples:
Healthcare
- Patient readmission prevention: Predictive models examine past patient data to identify individuals at high risk of readmission, enabling early intervention and customized care plans.
- Chronic disease management: Predictive analytics tools forecast disease progression and tailor treatment plans for better management of chronic conditions.
- Operational efficiency: Hospitals use predictive analytics to streamline staffing, manage resources effectively, and lower operational costs.
Insurance
- Fraud detection: Historical claims data is analyzed to detect patterns suggestive of fraud, thereby preventing fraudulent claims and potential threats.
- Risk assessment: Behavioral data and external factors are utilized to evaluate policyholders’ risk profiles, optimizing policy pricing and coverage.
- Claims management: Efficiently streamline claims processing by predicting high-cost claims and effectively managing resources.
Retail
- Demand forecasting: Retailers use predictive modeling techniques to forecast future product demand, ensuring efficient inventory management and avoiding stock outs or overstock.
For example, Carrefour utilizes AI-powered predictive analytics for inventory management, reducing stock outages and overstocking. - Personalized marketing: Analyzing customer purchase history and behavior enables retailers to craft personalized marketing campaigns and product recommendations. These are based on richer customer insights, which boost customer satisfaction and foster loyalty.
For instance, Auchan uses geo-tracking and predictive analytics to notify customers about nearby stores and current promotions, enhancing customer engagement and loyalty. - Pricing optimization: Retailers use predictive analysis to set optimal prices, considering factors like competitor pricing, demand trends, and customer behavior, to maximize revenue.
- Customer churn prediction: Identifying customers at risk of leaving and implementing retention strategies to maintain engagement and loyalty.
- Supply chain management: Predictive analytics tools optimize inventory levels, forecasts demand for slow-moving items, and determines restocking schedules, enhancing efficiency across the supply chain.
Real estate
- Property valuation: Predictive models estimate property values by analyzing historical sales data, neighborhood attributes, and market trends.
- Market trend prediction: Forecasting market trends helps identify promising investment locations and optimize pricing strategies.
- Rental yield forecasting: Predictive analytics forecasts rental yields using historical rental data and economic indicators, aiding investors in decision-making.
- Investment analysis: Identifying hidden investment opportunities and evaluating risk and return profiles for diverse properties.
- Property management: Predicting maintenance requirements and optimizing energy consumption to enhance efficiency in property management.
Function-specific uses of Predictive Analytics
Predictive analytics can significantly benefit various functions within an organization. Here are some key areas:
- Human Resources (HR): Predictive analytics helps HR by pinpointing skills gaps, forecasting turnover, and optimizing recruitment processes.
- Marketing: Predictive analytics enables marketers to understand customer behavior, personalize campaigns, and enhance marketing effectiveness through data-driven insights.
- Sales: Predictive analytics empowers sales teams to predict performance, identify leads, and understand customer behaviors, enhancing productivity and refining sales strategies.
- Supply chain management: Predictive models in supply chain forecast demand, optimize inventory, prevent stock issues, schedule production, manage logistics, and reduce costs by anticipating disruptions and adjusting strategies.
Predictive Analytics tools
Interested in getting started with predictive analytics? Here are some tools that will help you make the first steps in utilizing predictive analytics in your organization:
SAP
SAP is a leading global provider of enterprise resource planning (ERP) software. They offer an extensive range of solutions, including SAP Predictive Analytics among them.
More specifically, SAP Predictive Analytics is a tool designed for creating predictive models using machine learning and statistical algorithms. It integrates seamlessly with other SAP products, making it ideal for businesses already using SAP systems.
Power BI
Power BI is a business analytics tool by Microsoft that provides interactive visualizations and business intelligence capabilities. It has a simple interface for end users, which enables them to create their own reports and dashboards.
It excels in handling large datasets and offers robust data visualization capabilities. Additionally, it integrates well with other Microsoft products, making it a powerful tool for organizations already using Microsoft Office.
Microsoft Excel
Excel is a well-known spreadsheet application in the industry developed by Microsoft. Excel is used for data organization, analysis, and visualization. It includes a wide range of functions and tools for statistical analysis and forecasting. Excel is widely accessible and easy to use, making it a good starting point for those new to predictive analytics. It is versatile and can handle a variety of data analysis tasks.
Tableau
Tableau is a data visualization tool that helps users create interactive and shareable dashboards. It is known for its powerful visualization capabilities and ease of use, as it can handle large datasets and integrates with various data sources, making it ideal for businesses that need to visualize complex data. However, compared to Power BI (as a competitor) it has a steeper learning curve, making it more suitable for seasoned data analysts.
Python
Python is a versatile programming language widely used for data analysis and machine learning. It has numerous libraries like pandas, NumPy, scikit-learn, and TensorFlow that facilitate predictive analytics.
Python is highly flexible and powerful, making it suitable for complex predictive analytics tasks. It is open-source and has a large community, providing extensive resources and support. Lastly, as it is a programming language, coding experience or affinity is required in order to be able to perform predictive analyses.
Explore Predictive Analytics with AI
Do you utilize predictive analytics techniques within your organization? Are you ready to explore how to leverage AI and enhance your predictive analytics models even further? Get in contact with the AI Experts at DataNorth. Discover how to accelerate data processing, save time, and gain deeper insights. Enhance the possibilities of Predictive Analytics with advanced machine learning algorithms that traditional methods may overlook.


