Want to take the next step into machine learning? This blog will help you set up your first machine learning model, written by the AI experts of DataNorth.
What are the fundamentals of Machine Learning
Before we set up our machine learning model, we first need to understand the fundamentals of machine learning. In machine learning there are three important types in machine learning; supervised learning, unsupervised learning and reinforcement learning.
- Supervised learning; uses labeled datasets to train algorithms.
- Unsupervised learning; uses non labeled datasets to train algorithms.
- Reinforcement learning; can be trained by itself through trial and error and from the results it will improve over time.
In this blog we will talk about supervised and unsupervised learning. Reinforcement learning uses more technical methods and algorithms, which would be the next step in your machine learning journey.
Setting up your Machine Learning model
Installation
Before training the model you need to install some tools on your computer to run Python code and to set up your first machine learning model.
- Python: First, you’ll need to install Python. It’s the primary programming language for machine learning, and you can download it from python.org.
- IDE/Editor: You’ll also need an Integrated Development Environment (IDE) or a code editor to write your Python scripts. Popular choices include:
- Jupyter Notebook: Ideal for experimenting with code in an interactive, notebook-style environment. You can install it via Anaconda or using the command pip install notebook.
- VS Code: A powerful code editor with great support for Python. Install VS code here and add the Python extension.
- Libraries: To run the machine learning models in this blog, you’ll need the following Python libraries:
- NumPy: For handling arrays and mathematical operations. Install it using pip install numpy.
- Scikit-learn: A machine learning library that includes algorithms like Linear Regression and KMeans. Install it with pip install scikit-learn.
Once you have these tools installed, the next step is to choose the machine learning algorithm you want to use.
Collecting your data
When starting your own machine learning model, the first thing we need to do is collect your data. This can be your own dataset, or datasets from other platforms like Kaggle. Kaggle is a platform that provides datasets that you can use to build AI models.
Prepare your data
When you have your dataset you have to decide if the usability is high enough to use for your machine learning model. What we mean by usability is that the dataset has enough data to work from. When there is data missing, incorrect data or outliers, we have to first clean the dataset. When data needs to be cleaned you can follow the steps below to prep the data before using it to train your model.
Key steps for data preparation
- Data cleaning; remove duplicates to avoid unbiased results
- Feature engineering; create new features from existing data and encode categorical variables into numerical formats.
- Normalization and scaling; normalize numerical features to ensure a similar scale using techniques like min-max scaling or z-score normalization.
- Outlier management; identify outliers and decide how to handle them based on their impact on your model.
- Data splitting; divide your dataset into training and test sets.
- Feature selection; select relevant features to improve model performance and reduce overfitting.
- Data validation; conduct checks to ensure the cleaning process hasn’t introduced biases or errors.
Where to put the dataset
Organize your files by saving your dataset in a folder on your computer, ideally in a directory where all your project files will be stored. To load in your dataset in Python, you can use libraries like Pandas to load the dataset into your script.

Choosing a model and get started with ML
Now that your dataset is ready, the next step is choosing a model. This depends on several factors, including the type of problem you are solving (classification, regression, clustering, etc.).
Let’s break it down, in the beginning of this blog we talked about the machine learning types; supervised learning, unsupervised learning and reinforcement learning. Let’s match the types of machine learning models with methods and algorithms to make it easier to choose your model.
Supervised learning approaches
Supervised learning involves training a model using labeled data, and it can be categorized into two main approaches: classification and regression. Classification focuses on assigning data points to predefined labels or classes, such as identifying whether an email is spam or not. In contrast, regression is used to predict continuous numerical values, such as forecasting house prices or stock market trends.
| Key differences | ||
| Feature | Classification | Regression |
| Output | Discrete categories (e.g., 0, 1, “A”, “B”) | Continuous values (e.g., 3.5, 98.7) |
| Purpose | Classify into categories | Predict numerical output |
| Use case | Fraud detection, disease diagnosis | price prediction, stock forecasting |
| Variable | Categorical | Continuous |
Classification
This is a machine learning method that tries to predict the correct label of a given input data. As an example we take two classification algorithms; Naive Bayes and Super Vector Machine. These algorithms build a model from the training dataset before making any prediction on future datasets. Algorithms to use when using this method;
- Naive bayes
- Super Vector Machine
Regression
This is a machine learning method used to analyze the relationship between a dependent variable (target variable) and an independent variable (predictor variable). The goal is to determine the most powerful function that characterizes the connection between these two. Algorithms to use for this method;
- Decision tree
- Logistic regression
- Linear regression
Unsupervised learning
Unsupervised learning is a type of machine learning that works with unlabeled data, discovering hidden patterns or structures within it. Two primary approaches are clustering and dimensionality reduction. Clustering aims to group similar data points into clusters based on shared patterns or features, such as segmenting customers by purchasing behavior. Dimensionality reduction simplifies datasets by reducing the number of features while preserving as much valuable information as possible, often used for visualizing high-dimensional data or improving model efficiency.
| Key differences | ||
| Feature | Clustering | Dimensionality reduction |
| Output | Cluster labels for data points (e.g., “Cluster 1”, “Cluster 2” | A dataset with fewer dimensions, typically in numerical form |
| Purpose | Grouping similar data points into clusters | Reducing data complexity while preserving key information |
| Use case | Customer segmentation, pattern recognition, anomaly detection | Data visualization, improving model performance |
| Variable | Uses original variables to form clusters | Transforms variables into new combinations or a lower-dimensional space |
Clustering
This is a machine learning method that uses both categorical and numeric features to group unlabeled data based on their similarities to each other. Algorithms to use when using this method;
- K-means
- Mean shift
Dimensionality reduction
This is a machine learning method for representing a given dataset using a lower number of features. It will remove irrelevant data to create a model with a lower number of variables. Algorithms to use when using this method;
- Principal component analysis
- Feature selection
- Linear discriminant analysis
Training the Model
In this chapter we will go through all the steps to training your own machine learning model. From what we have discussed before you can use the two machine learning methods; supervised and unsupervised learning. Now we will focus on the technical aspects of setting up the machine learning model.
Supervised learning
The machine learning algorithm is trained on a labeled dataset. This means that each example in the training dataset, the algorithm knows what the correct output is. The algorithm uses that knowledge to try to generalize to new examples that it’s never seen before. Using labeled inputs and outputs, the model can measure its accuracy and learn over time.
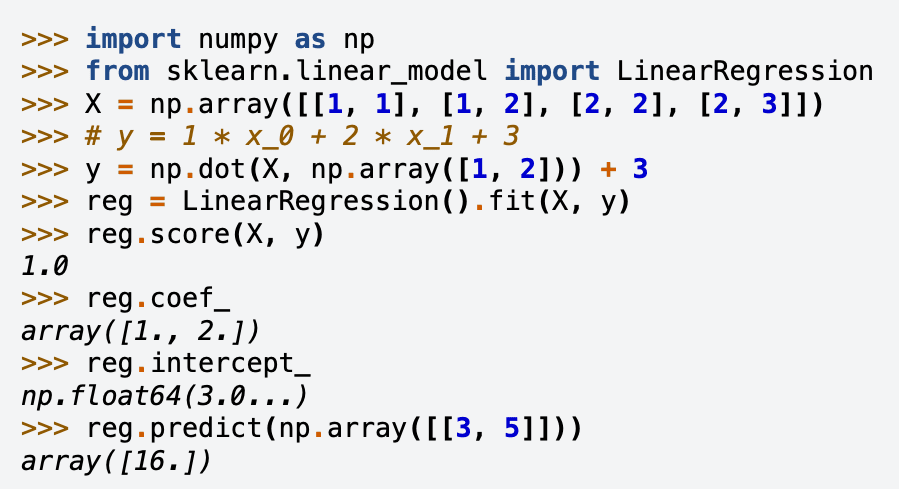
For this example we will use linear regression, let’s start training a linear regression model together. Let’s take this example of sklearn to walk through the steps of setting up a linear regression.
Step 1: Open your IDE or code editor
To get started open your preferred IDE or code editor, such as Jupyter Notebook or VS Code.
Step 2: Importing libraries
Import a library (NumPy) for working with numbers and arrays (tables of numbers).
import numpy as npThen brings in a tool called Linear Regression to find relationships between numbers.
from sklearn.linear_model import LinearRegressionStep 3: Creating data (X and y)
What is x?
x is a table where each row represents a set of input numbers. Each input has two numbers (columns). For example, the first row [1, 1] means the first input is 1, and the second input is also 1.
What is y?
y is a set of output numbers that are calculated using a specific rule. Think of it as the “answers” that correspond to each row in X.
For each row in X, follow this rule: take the first number and multiply it by 1, then take the second number and multiply it by 2. Add these two results together, and finally, add 3 to get the total.
Step 4: Training the model
reg = LinearRegression().fit(X, y): Trains the model to learn the relationship between X and y using Linear Regression.
Step 5: Checking the fit
reg.score(X, y): Checks how well the model learned the relationship; a score of 1.0 means the model learned it perfectly.
Step 6: Finding the relationship
reg.coef_: Shows the coefficients (weights) the model learned for each column in X. The result is [1.,2.], it multiplies the first column by 1 and the second by 2.
reg.intercept_: Shows the constant (starting point) the model learned. In this case the result is 3.0.
Step 7: Making predictions
reg.predict(np.array([[3, 5]])): Predicts the output for new input [3, 5]. The formula used; (1×3) + (2×5) + 3 = 16. Which results in [16]. Underneath you can see an example of how a linear regression would look like. As you can see it’s a straight line going up, where each point represents a relationship between two things. The goal is drawing the straight line that fits the best between those points. The line will then help you predict the value of the data you want to collect.
Unsupervised learning
This machine learning algorithm is trained on an unlabeled dataset. Because of that the algorithm has to discover hidden patterns in data without the need of human input.
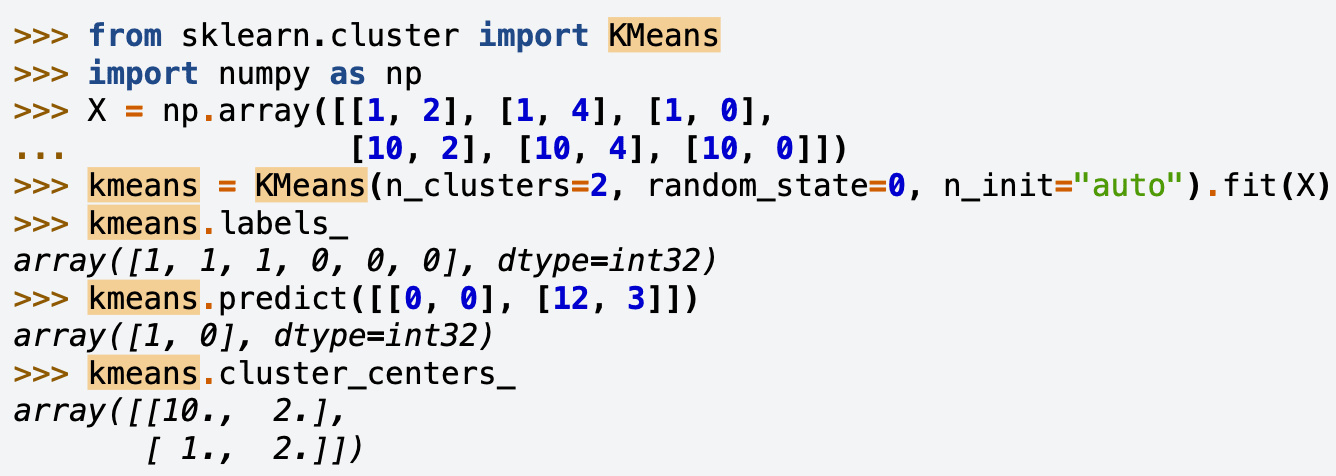
For this example we will use k-means, let’s start training an k-means model together. Let’s go to sklearn again for an example and walk through the steps of setting up an k-means model.
Step 1: Open your IDE or code editor
To get started open your preferred IDE or code editor, such as Jupyter Notebook or VS Code.
Step 2 : Importing libraries
Import a library (NumPy) for working with numbers and arrays (tables of numbers).
import numpy as npThen brings in a tool called Linear Regression to find relationships between numbers.
from sklearn.linear_model import KMeansfrom sklearn.cluster import KMeans: Brings in a tool called KMeans, which is used for grouping data points into clusters based on their similarities. KMeans helps identify patterns by grouping similar data together.
Step 3: Creating data (X)
First, we create some data that we want to group together. Your X- values is the data we are going to analyze, and it represents the points we want to cluster (group) based on their similarities. We don’t need y in KMeans because it doesn’t use labeled data (it’s unsupervised learning). For KMeans, we just focus on the X data.
Step 4: Checking the fit
Now, we train the model. KMeans; this means we are asking the algorithm to look at the data and figure out how many groups (clusters) it should divide the data into. For example, you can tell KMeans you want 2 clusters (groups), and it will find two sets of points that are close to each other.
Step 5: Finding the relationship
Once the model is trained, we can check how well it grouped the data by looking at which points belong to which group. KMeans will give a “label” to each point; kmeans.labels. It shows which group it belongs to. For example, KMeans might say the first three points belong to one group and the last three belong to another.
Step 6: Making predictions
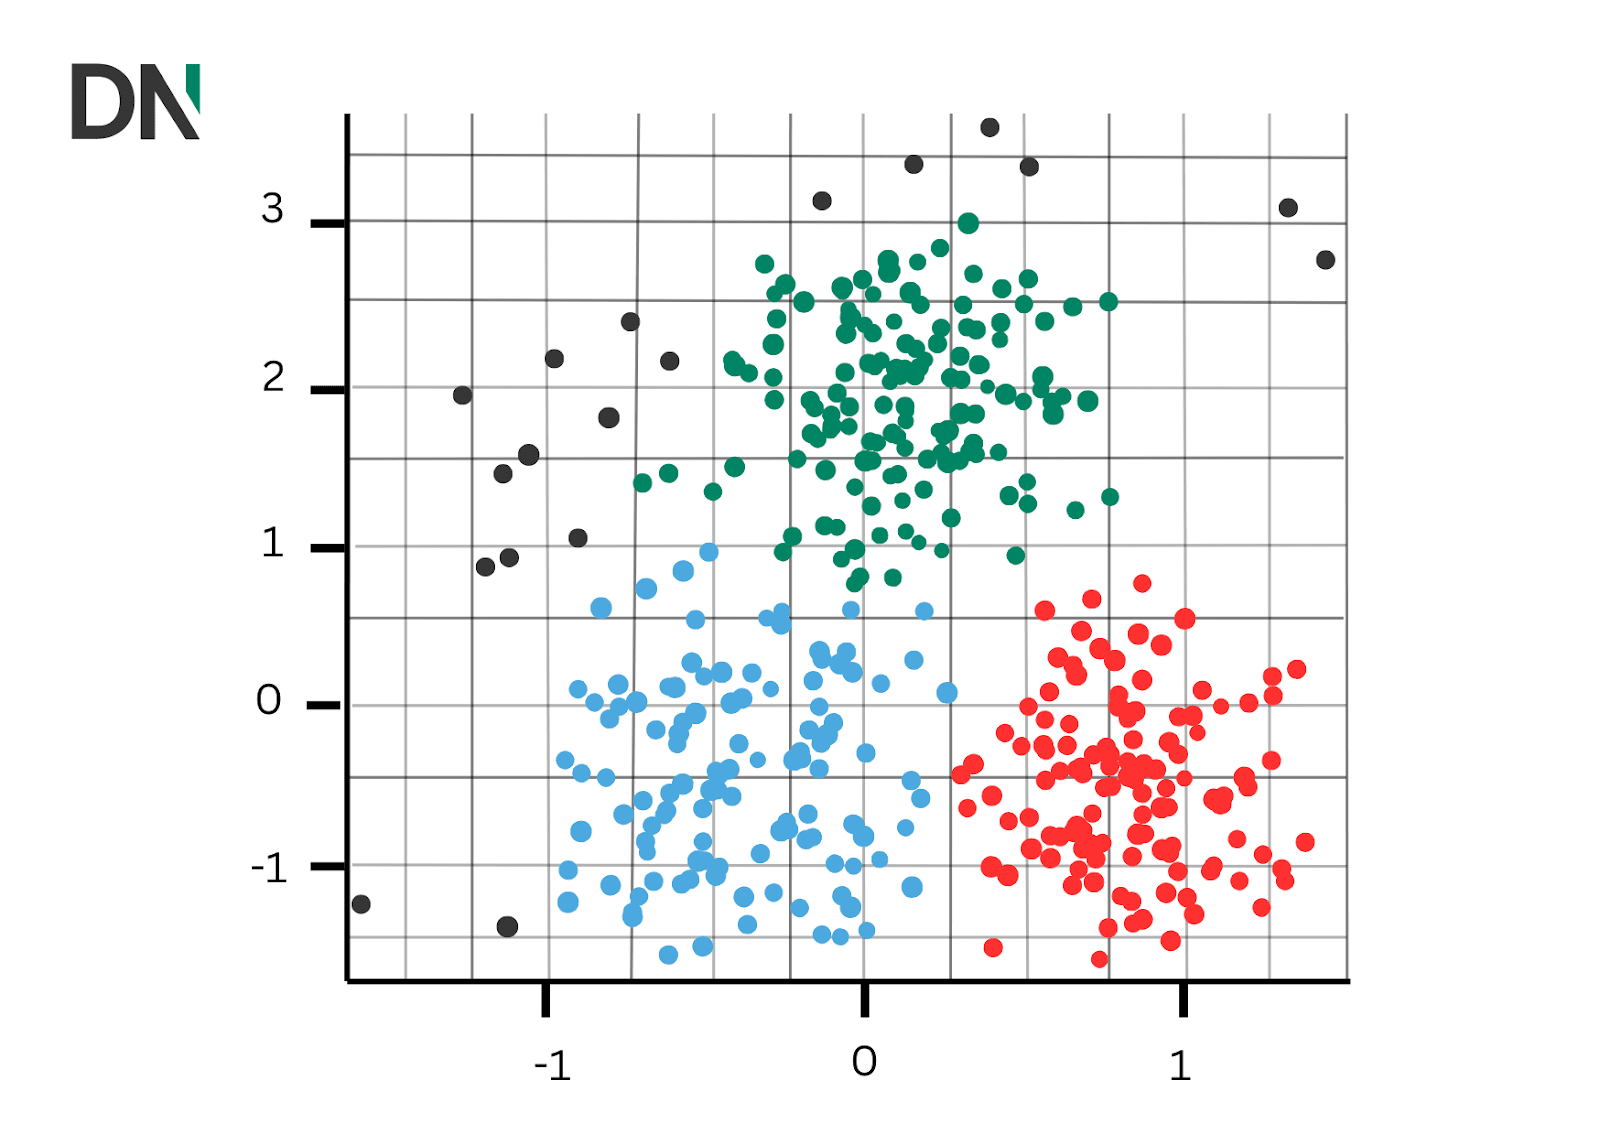
Finally, you can ask the model to predict which group a new point will belong to. The KMeans clustering graph shows data points grouped into clusters, each represented by a different color. The algorithm divides the points based on their similarities, which is the average position of all points in that group. Each point is assigned to a cluster, and the clusters help identify patterns in the data based on how close the points are to each other.
Get started with ML
To conclude this blog we discussed what machine learning is and gave you examples of how to set up your first machine learning model. Whether you are using supervised learning like linear regression for labeled data or unsupervised learning like kmeans clustering for unlabeled data. The process for setting up a machine learning model involves understanding the problem, preparing the data and choosing the right model. By following these steps you can start building your own machine learning model. Overall, it’s important to experiment with different models and see which one works the best for your datatype.
If you are ready to take the next step in your machine learning journey but want more expertise, we at DataNorth are here to help. Our AI engineers have their bachelors and masters in this field and are there to consult you in your machine learning process. Don’t hesitate to contact us.


